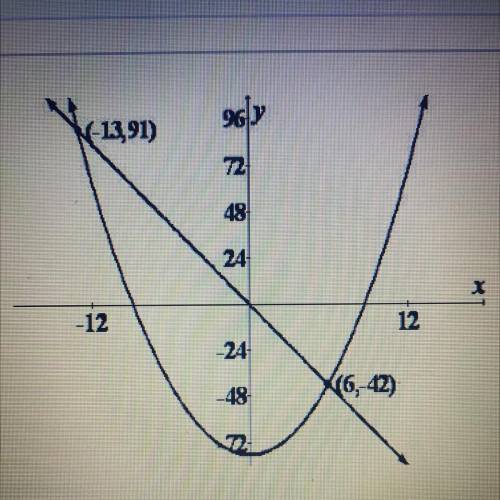
The graph shown can be used to solve which of these systems of equations?
A)
y = -7x and y =...

Mathematics, 04.12.2020 08:40 Legojackson78
The graph shown can be used to solve which of these systems of equations?
A)
y = -7x and y = x - 78
B)
y = -7x and y = x2 - 78
C)
y = 7x and y = x - 78
D)
y = 7x and y = x2 - 78

Answers: 3


Other questions on the subject: Mathematics
Mathematics, 21.06.2019 15:40, helper4282
The number of lattes sold daily for two coffee shops is shown in the table: lattes 12 52 57 33 51 15 46 45 based on the data, what is the difference between the median of the data, including the possible outlier(s) and excluding the possible outlier(s)? 48.5 23 8.4 3
Answers: 3
Mathematics, 21.06.2019 21:40, dededese2403
Astudy was interested in determining if eating milk chocolate lowered someone's cholesterol levels. ten people's cholesterol was measured. then, each of these individuals were told to eat 100g of milk chocolate every day and to eat as they normally did. after two weeks, their cholesterol levels were measured again. is there evidence to support that their cholesterol levels went down? how should we write the alternative hypothesis? (mud = the population mean difference= before - after)a. ha: mud = 0b. ha: mud > 0c. ha: mud < 0d. ha: mud does not equal 0
Answers: 1
You know the right answer?
Questions in other subjects:

History, 30.10.2019 20:31

History, 30.10.2019 20:31


Biology, 30.10.2019 20:31
English, 30.10.2019 20:31
Mathematics, 30.10.2019 20:31


