
Mathematics, 04.12.2020 08:00 boi1234520
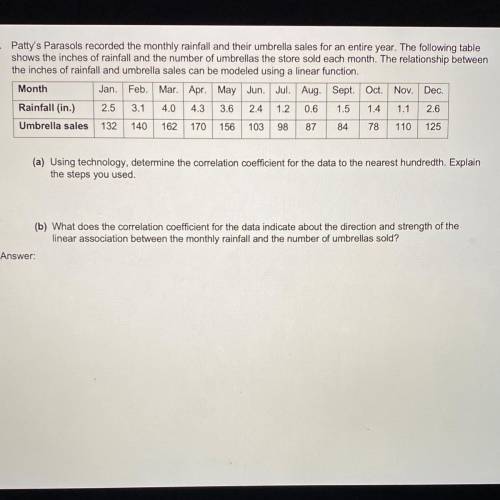
Patty's Parasols recorded the monthly rainfall and their umbrella sales for an entire year. The following table
shows the inches of rainfall and the number of umbrellas the store sold each month. The relationship between
the inches of rainfall and umbrella sales can be modeled using a linear function.
A) using technology, determine the correlation coefficient for the data to the nearest hundredth. Explain the steps you used.
B) what is the correlation coefficient for the data indicate about the direction and strength of the linear association between the monthly rainfall and the number of umbrella sold?

Answers: 1


Other questions on the subject: Mathematics
Mathematics, 21.06.2019 15:50, kendallreed39
3-12. write each answer with a reasonable number of figures. find the absolute uncertainty and percent relative uncertainty for each answer. (a) [12.41 (±0.09) + 4.16 (±0.01)] x 7.068 2 (±0.000 4) =? (b) [3.26 (±0.10) x 8.47 (±0.05)] - 0.18 (±0.06) =? (c) 6.843 (±0.008) x 104 + [2.09 (±0.04)- 1.63 (±0.01)] =?
Answers: 1
Mathematics, 21.06.2019 17:00, cjd1214812148
The rectangle on the right is the image of the rectangle on the left. what transformation would result in this image? reflection rotation translation dilation
Answers: 2
Mathematics, 21.06.2019 18:00, ccdarling7185
The only way to identify an intercept is as an ordered pair. true false
Answers: 1
Mathematics, 21.06.2019 18:30, PineaPPle663
Which one ? is the answer and how to find this answer
Answers: 2
You know the right answer?
Patty's Parasols recorded the monthly rainfall and their umbrella sales for an entire year. The foll...
Questions in other subjects:

Mathematics, 08.09.2020 07:01

Computers and Technology, 08.09.2020 07:01
Mathematics, 08.09.2020 07:01

Business, 08.09.2020 07:01
Mathematics, 08.09.2020 07:01

History, 08.09.2020 07:01

English, 08.09.2020 07:01


