
Mathematics, 03.12.2020 23:00 den14
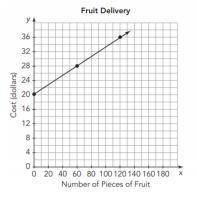
Determine whether the graph represents a proportional or non-proportional relationship. Then select the correct equation in the form y=mx or y=mx+b to represent the relationship between the independent and dependent quantities.
This graph is an example of a blank area relationship. The equation that represents the relationship between the independent and dependent quantities is blank area.
Proportional
Unproportional
y=5x+20
y=60x
y=x+30
Help me fill in the blanks plz

Answers: 2


Other questions on the subject: Mathematics
Mathematics, 21.06.2019 19:30, daquanmcqueen77
Are triangles the congruent? write the congruency statement. what is the congruency that proves they are congruent? what is the perimeter of ∆pqr?
Answers: 1
Mathematics, 21.06.2019 22:00, gerardoblk5931
Question 10 of 211 pointuse the elimination method to solve the system of equations. choose thecorrect ordered pair.10x +2y = 643x - 4y = -36a. (4,12)b. (-3, 11)c. (2,10)d. (-5, 8)
Answers: 1
Mathematics, 21.06.2019 22:00, mollybeale
Luke wants to reduce the area of his rectangular garden by 1/4 the expression 14/w can be used to represent this change. what is another way to write this expression?
Answers: 1
You know the right answer?
Determine whether the graph represents a proportional or non-proportional relationship. Then select...
Questions in other subjects:

Social Studies, 15.11.2019 02:31

Computers and Technology, 15.11.2019 02:31
Mathematics, 15.11.2019 02:31

Health, 15.11.2019 02:31
Mathematics, 15.11.2019 02:31


