
Mathematics, 03.12.2020 20:20 perezsamantha3oqr0za
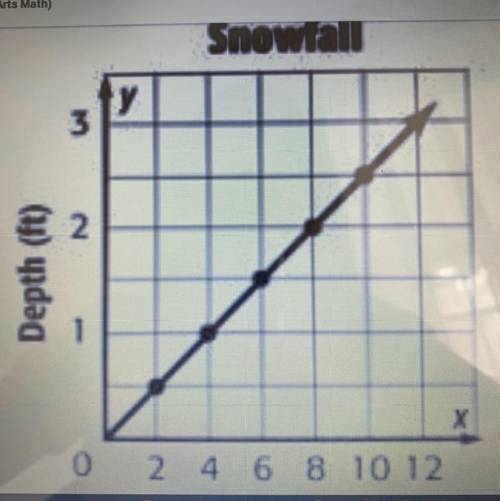
1- Use the graph at the right. It shows the depth in feet of snow after each two-hour period during
a snowstorm.*
2- does the graph show a constant rate of change? Explain
3- if the graph is extended to the right, could you expect the slope to remain constant? Explain
Plisss help me

Answers: 1


Other questions on the subject: Mathematics
Mathematics, 21.06.2019 23:00, Izzyfizzy1
The value of cos 30° is the same as which of the following?
Answers: 1
Mathematics, 22.06.2019 00:30, kadinmorgan
The value, v, of kalani’s stock investments over a time period, x, can be determined using the equation v=750(0.80)^-x. what is the rate of increase or decrease associated with this account? 20% decrease 20% increase 25% decrease 25% increase
Answers: 1
You know the right answer?
1- Use the graph at the right. It shows the depth in feet of snow after each two-hour period during...
Questions in other subjects:

Social Studies, 10.10.2021 23:50
Mathematics, 10.10.2021 23:50

Mathematics, 10.10.2021 23:50
Mathematics, 10.10.2021 23:50


Physics, 10.10.2021 23:50
Mathematics, 11.10.2021 01:00


