
Mathematics, 02.12.2020 23:30 Andyrogers
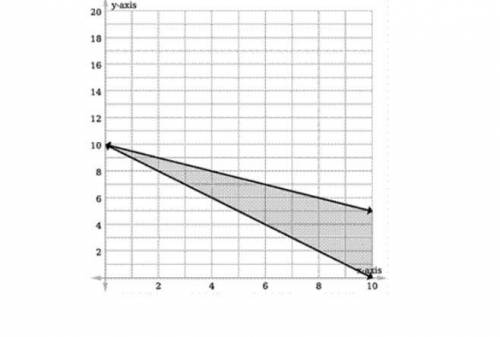
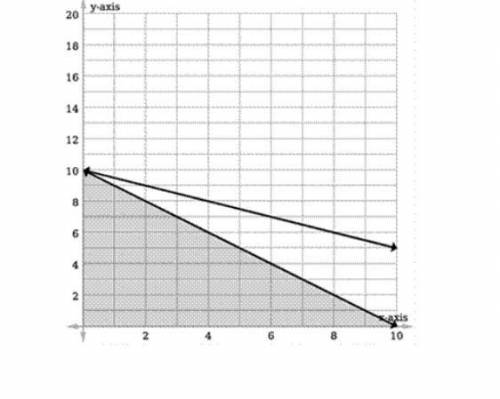
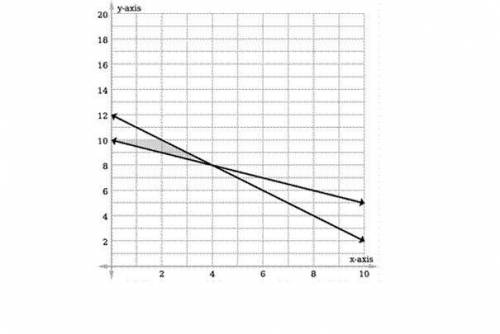
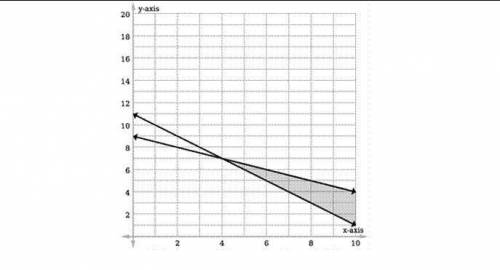
PLEASE HELP I REALLY NEED IT Which graph represents the solution set of the following situation? Andrew is buying fruit for a fruit salad. Bananas cost $1 a pound and oranges cost $2 a pound. He plans to buy at least 10 pounds of fruit and spend no more than $20. Let x represent pounds of bananas and let y represent pounds of oranges..

Answers: 3


Other questions on the subject: Mathematics
Mathematics, 21.06.2019 17:00, MrKrinkle77
Igor stravinsky tires sells approximately 3,760,000 car tires and 1,200,000 truck tires each year. about 47,000,000 care tires and 26,000,00 truck tires are sold each year in the united states. what is stravinsky's market share in each of these two markets (cars and trucks)?
Answers: 1
Mathematics, 21.06.2019 22:00, danielahalesp87vj0
18 16 11 45 33 11 33 14 18 11 what is the mode for this data set
Answers: 2
You know the right answer?
PLEASE HELP I REALLY NEED IT Which graph represents the solution set of the following situation? An...
Questions in other subjects:


Physics, 19.03.2020 22:33

Geography, 19.03.2020 22:33


