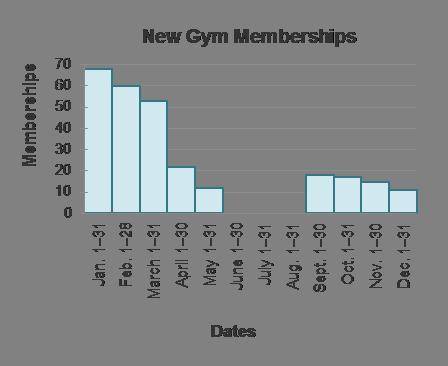
Use the histogram and the drop-down menus to complete the statements.
This histogram has
c...

Mathematics, 02.12.2020 20:20 GabbiL
Use the histogram and the drop-down menus to complete the statements.
This histogram has
clusters.
The clusters tell us when there is a
frequency of new memberships.
The peak in
tells us when the
new memberships were sold.
The intervals on the graph where there are no bars tell us there were
new memberships sold

Answers: 2


Other questions on the subject: Mathematics
Mathematics, 21.06.2019 19:00, anaiyamills
Which graph represents the parent function of y=(x+2)(x-2)
Answers: 1
You know the right answer?
Questions in other subjects:

Computers and Technology, 10.05.2021 14:00
Mathematics, 10.05.2021 14:00

English, 10.05.2021 14:00

Mathematics, 10.05.2021 14:00
Mathematics, 10.05.2021 14:00
Mathematics, 10.05.2021 14:00

Physics, 10.05.2021 14:00


