
Mathematics, 02.12.2020 20:20 Joshuafranklindude
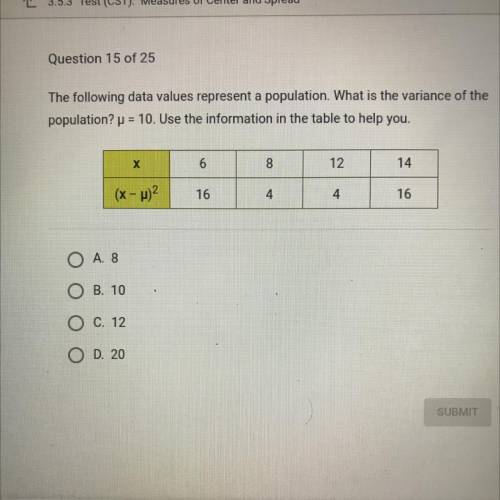
The following data values represent a population. What is the variance of the
population? u= 10. Use the information in the table to help you.
X
6
8
12
14
(x-)2
16
4
4
16
O A. 8
B. 10
O C. 12
D. 20

Answers: 3


Other questions on the subject: Mathematics
Mathematics, 21.06.2019 16:30, puremousetail
In two or more complete sentences describe how to determine the appropriate model for the set of data, (1,1), (3,2), (6,3), (11,4).
Answers: 1
You know the right answer?
The following data values represent a population. What is the variance of the
population? u= 10. Us...
Questions in other subjects:

History, 07.07.2019 04:00
History, 07.07.2019 04:00

Biology, 07.07.2019 04:00
Mathematics, 07.07.2019 04:00


