
Mathematics, 02.12.2020 20:00 ashleytorrao65541
The figure shows a line graph and two shaded triangles that are similar:
A line is shown on a coordinate grid. The x axis values are from negative 15 to positive 15 in increments of 3 for each grid line. The y axis values are from negative 5 to positive 5 in increments of 1 for each grid line. The line passes through the ordered pairs negative 12, negative 4, and 0, 0, and 12, 4. A shaded right triangle is formed so that its hypotenuse is from ordered pair 0, 0 labeled O to negative 6, negative 2 labeled A, one leg is from 0, 0 to 0, negative 2, and the second leg is from 0, negative 2 to negative 6, negative 2. Another shaded right triangle is formed with the hypotenuse from negative 6, negative 2 to negative 9, negative 3 labeled B, one leg is from negative 6, negative 2 to negative 6, negative 3, and the second leg is from negative 9, negative 3 to negative 6, negative 3.
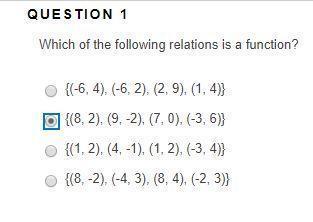
Which statement about the slope of the line is true?
It is 3 throughout the line.
It is fraction 1 over 3 throughout the line.
The slope from point O to point A is fraction 1 over 3 time the slope of the line from point A to point B.
The slope from point O to point A is three times the slope of the line from point A to point B.

Answers: 2


Other questions on the subject: Mathematics
Mathematics, 21.06.2019 19:30, gyliahicks
Jada has a meal in a restaurant she adds up the prices listed on the menu for everything they ordered and gets a subtotal of $42.00. after tax the total is 45.99. what percentage of the subtotal is the total?
Answers: 2
Mathematics, 21.06.2019 22:00, reesewaggoner8
Uestion 1(multiple choice worth 5 points) (05.02)alex wants to paint one side of his skateboard ramp with glow-in-the-dark paint, but he needs to know how much area he is painting. calculate the area of the isosceles trapezoid. isosceles trapezoid with top base 12 feet, bottom base of 18 feet, and height of 6 feet. 72 ft2 84 ft2 90 ft2 108 ft2
Answers: 1
You know the right answer?
The figure shows a line graph and two shaded triangles that are similar:
A line is shown on a coord...
Questions in other subjects:


