
Mathematics, 02.12.2020 17:10 Panthers23
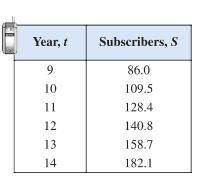
The table shows the numbers of cellular phone subscribers S (in millions) in the United states from 1999 through 2004, where t represents the year, with t = 9 corresponding to 1999. Use the regression feature of a graphing utility to find a linear model for the data. Use the model to find the year in which the number of subscribers exceeded 200 million.

Answers: 2


Other questions on the subject: Mathematics
Mathematics, 21.06.2019 17:00, heysonic91
The perimeter of a movie screen is 54 meters. the screen is 18 meters wide. how tall is it?
Answers: 1
Mathematics, 21.06.2019 20:00, Chen5968
The distribution of the amount of money spent by students for textbooks in a semester is approximately normal in shape with a mean of $235 and a standard deviation of $20. according to the standard deviation rule, how much did almost all (99.7%) of the students spend on textbooks in a semester?
Answers: 2
Mathematics, 21.06.2019 22:10, markayla101326
In which direction does the left side of the graph of this function point? f(x) = 3x3 - x2 + 4x - 2
Answers: 2
You know the right answer?
The table shows the numbers of cellular phone subscribers S (in millions) in the United states from...
Questions in other subjects:
Mathematics, 02.07.2020 23:01
Mathematics, 02.07.2020 23:01


Mathematics, 02.07.2020 23:01


