Understanding a Correlation Coefficient
Data
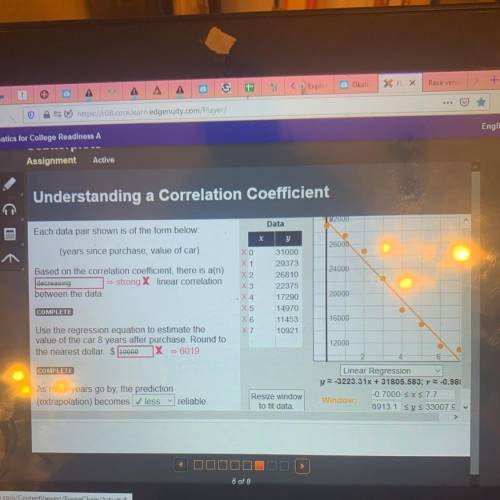
Each data pair shown is of the form below:
...

Mathematics, 02.12.2020 05:40 katelynnjoyce1
Understanding a Correlation Coefficient
Data
Each data pair shown is of the form below:
192000
X
Y
(years since purchase, value of car)
28000
Хо
X1
X2
24000
Based on the correlation coefficient, there is a(n)
decreasing = strong X linear correlation
between the data
X3
. X4
X 5
31000
29373
26810
22375
17290
14970
11453
20000
COMPLETE
X6
16000
X 7
10921
Use the regression equation to estimate the
value of the car 8 years after purchase. Round to
the nearest dollar. $ 10000 X = 6019
12000
COMPLETE
As more years go by, the prediction
(extrapolation) becomes ✓ less
Linear Regression
y-3223.31x + 31805.583; r -0.981
-0.7000 SXS 7.7
Window
8913.1 sy $ 33007..
reliable
Resize window
to fit data.

Answers: 3


Other questions on the subject: Mathematics
Mathematics, 20.06.2019 18:04, Adones5104
To prove "p is equal to q" using an indirect proof, what would your starting assumption be?
Answers: 1
Mathematics, 21.06.2019 22:00, wazzuphottie1999
Iam at home. /: i am playing video games. translate the following statement into symbolic form.
Answers: 2
You know the right answer?
Questions in other subjects:

Mathematics, 07.03.2020 03:06


