Graph the function.
g(x) = (x – 6)2 + 1
...

Mathematics, 01.12.2020 22:40 skyrileycasting
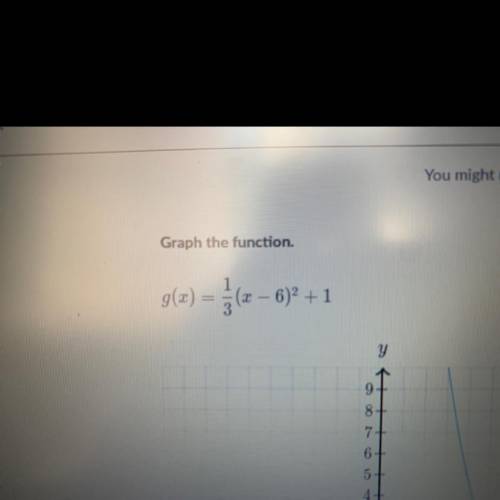
Graph the function.
g(x) = (x – 6)2 + 1

Answers: 3


Other questions on the subject: Mathematics
Mathematics, 21.06.2019 16:00, jeff7259
The scatter plot graph shows the average annual income for a certain profession based on the number of years of experience which of the following is most likely to be the equation of the trend line for this set of data? a. i=5350e +37100 b. i=5350e-37100 c. i=5350e d. e=5350e+37100
Answers: 1
Mathematics, 21.06.2019 17:10, babygail0818
Complete the table for different values of x in the polynomial expression -7x2 + 32x + 240. then, determine the optimal price that the taco truck should sell its tacos for. assume whole dollar amounts for the tacos.
Answers: 2
Mathematics, 21.06.2019 17:10, Playboycxm
Consider the following equation -167 + 37 = 49 - 21p select the equation that has the same solution as the given equation. o a. p - 5 + ip = 7 - p ob. +55 + 12p = 5p + 16 c. 2 + 1.25p = -3.75p + 10 d. -14 + 6p = -9 - 6p reset next
Answers: 3
You know the right answer?
Questions in other subjects:

History, 26.06.2019 17:00


History, 26.06.2019 17:00


