
Mathematics, 01.12.2020 20:00 nomad4547
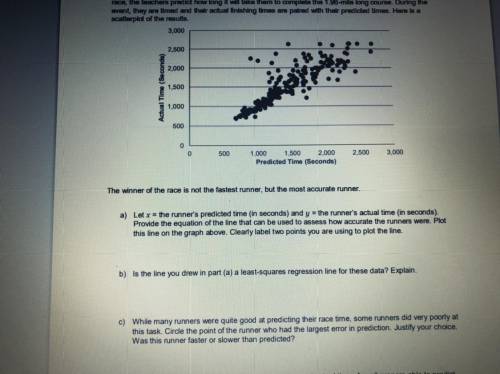
Ap statistics teachers from across the country meet annually in Kansas City to score Ap statistics exams. One social event that many teachers participate in is the annual prediction fun run. Prior to the race the teachers predict how long it will take them to complete the 1.96 mile long course. During the event, they are timed and their actual finishing times are paired with their predicted times. Here is a scatter plot of the results. The winner of the race is not the fastest runner but the most accurate runner. a.) let x=runners predicted time in seconds and y= the runner's actual time in seconds. Provide the equation of the line that can be used to assess how accurate the runners were. Plot this line on the graph above, Clearly label two points used to plot the line. B.) is the line you drew in part a) a least squares regression line for these data? Explain. C.) while many runners were quite good at predicting their race time, some runners did very poorly at this task. Circle the point of the runner who had the largest error in prediction. Justify your choice. Was this runner faster or slower than predicted?

Answers: 1


Other questions on the subject: Mathematics
Mathematics, 21.06.2019 18:30, george6871
Abus travels 36 miles in 45 minutes. enter the number of miles the bus travels in 60 minutes at this rate.
Answers: 2
Mathematics, 21.06.2019 21:50, libi052207
Free points also plz look my profile and answer really stuff
Answers: 2
Mathematics, 21.06.2019 22:00, sascsl2743
Determine if the equation defines y as a function of x: 2xy = 1. yes o no
Answers: 2
You know the right answer?
Ap statistics teachers from across the country meet annually in Kansas City to score Ap statistics e...
Questions in other subjects:


Computers and Technology, 12.11.2020 18:50
Mathematics, 12.11.2020 18:50

English, 12.11.2020 18:50

Physics, 12.11.2020 18:50


