The graph shows a proportional
relationship between the variables y and x. Write
an equation...

Mathematics, 30.11.2020 22:50 zel117
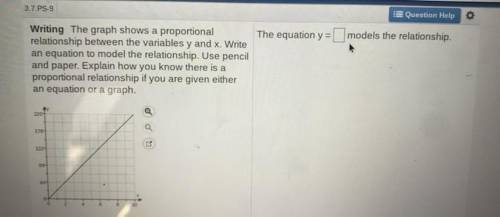
The graph shows a proportional
relationship between the variables y and x. Write
an equation to model the relationship. Use pencil
and paper. Explain how you know there is a
proportional relationship if you are given either
an equation or a graph.

Answers: 2


Other questions on the subject: Mathematics
Mathematics, 21.06.2019 16:30, sydthekid9044
Divide the following fractions 3/4 ÷ 2/3 1/2 8/9 9/8 2
Answers: 2
Mathematics, 21.06.2019 20:30, brandisouthern9
Awasher and a dryer cost $701 combined. the washer costs $51 more than the dryer. what is the cost of the dryer?
Answers: 1
You know the right answer?
Questions in other subjects:
Mathematics, 19.03.2021 02:20


Arts, 19.03.2021 02:20


Mathematics, 19.03.2021 02:20


Biology, 19.03.2021 02:20


