
Mathematics, 30.11.2020 20:30 batmanmarie2004
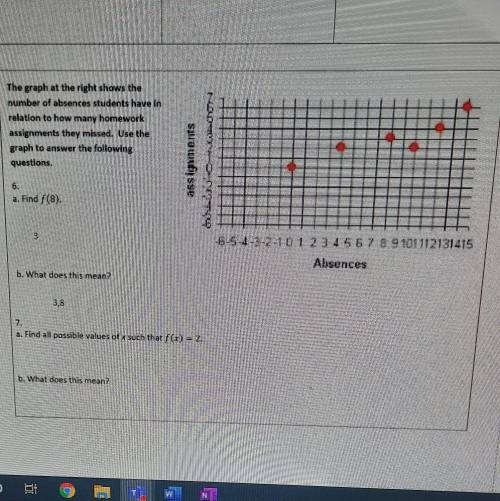
The graph at the right shows the number of absences students have in relation to how many homework assignments they missed. Use the graph to answer the following questions. assignments 6. a. Find F(8). 3 -6-5-4-3-2-1 0129567911112131415 Absences b. What does this mean? 3,8 7. a. Find all possible values of such that f(x) = 2. b. What does this mean?

Answers: 2


Other questions on the subject: Mathematics
Mathematics, 21.06.2019 19:00, babygirlmiller
The weight of an object in the water is 7% of its weight out of the water. what is the weight of a 652g object in the water?
Answers: 1
Mathematics, 21.06.2019 22:40, btaylor1179
Awoman has 14 different shirts: 10 white shirts and 4 red shirts. if she randomly chooses 2 shirts to take with her on vacation, then what is the probability that she will choose two white shirts? show your answer in fraction and percent, round to the nearest whole percent.
Answers: 3
Mathematics, 21.06.2019 23:30, weirdojuwin
In an isosceles triangle, the vertex angle is 112 degrees. what is the measure of each base. a.34 b.24 c.44 d.54
Answers: 1
You know the right answer?
The graph at the right shows the number of absences students have in relation to how many homework a...
Questions in other subjects:
Mathematics, 29.10.2019 05:31
Mathematics, 29.10.2019 05:31


Mathematics, 29.10.2019 05:31


