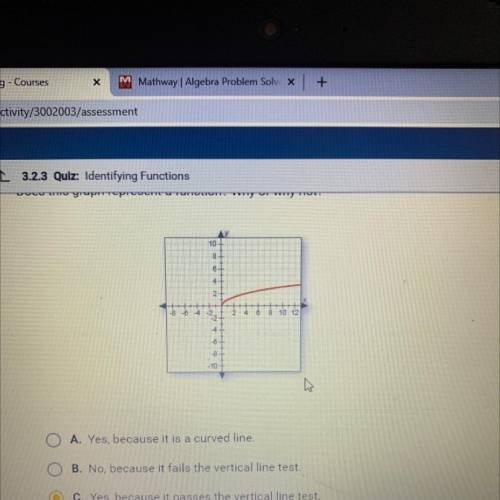
Does this graph represent a function ? why or why not ?
A. Yes, because it is a curved line .
...

Mathematics, 30.11.2020 19:10 nakeytrag
Does this graph represent a function ? why or why not ?
A. Yes, because it is a curved line .
B. No, because it fails the vertical line test .
C. Yes, because it passes the vertical line test .
D. No, because it is not a straight line .
answer : C

Answers: 2


Other questions on the subject: Mathematics
Mathematics, 21.06.2019 13:10, christopherarreola56
The function g(x) is defined as shown. x-1, -2 g(x) = 2x+3, -1 6-x, x23
Answers: 1
Mathematics, 21.06.2019 18:00, lnbrown9018
Find the number of liters in 12.8 gal of gasoline. round to the nearest hundredths
Answers: 2
Mathematics, 21.06.2019 22:30, lewismichelle11
Which statements are true about additional information for proving that the triangles are congruent check all that apply
Answers: 1
Mathematics, 22.06.2019 03:00, mustachbrah
Which point on the scatter plot is an outlier? a scatter plot is show. point m is located at 3 and 3, point p is located at 5 and 5, point n is located at 5 and 7, point l is located at 6 and 2. additional points are located at 1 and 3, 2 and 3, 2 and 4, 3 and 4, 3 and 5, 4 and 5, 4 and 6, 5 and 6. point p point n point m point l
Answers: 3
You know the right answer?
Questions in other subjects:

Social Studies, 16.01.2020 11:31

Mathematics, 16.01.2020 11:31

English, 16.01.2020 11:31

Biology, 16.01.2020 11:31
Mathematics, 16.01.2020 11:31


