
Mathematics, 30.11.2020 18:50 juliashalnev
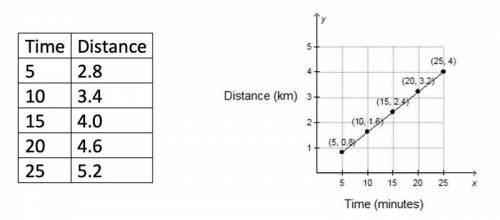
Do the graph and table represent the same information? Read the options carefully
1)Yes, because both intial value and rate of change are the same
2)No, because they have a different intial value and different rate of change
3) No, because they have a different intial value but same rate of change
4)No, because they have the same intial value but a different rate of change

Answers: 2


Other questions on the subject: Mathematics
Mathematics, 21.06.2019 14:00, maddynichole2017
Solve |2x - 5| = 4 if anyone could , that would be great
Answers: 1
Mathematics, 21.06.2019 21:30, achsahjosey
Acyclist bike x distance at 10 miles per hour .and returns over the same path at 8 miles per hour. what is the cyclist average rate for the round trip in miles per hour ?
Answers: 1
You know the right answer?
Do the graph and table represent the same information? Read the options carefully
1)Yes, because bo...
Questions in other subjects:

History, 13.10.2019 08:30

Social Studies, 13.10.2019 08:30
History, 13.10.2019 08:30
Mathematics, 13.10.2019 08:30


English, 13.10.2019 08:30
Mathematics, 13.10.2019 08:30
English, 13.10.2019 08:30


