
Mathematics, 30.11.2020 05:40 salam6809
Look at the graph.
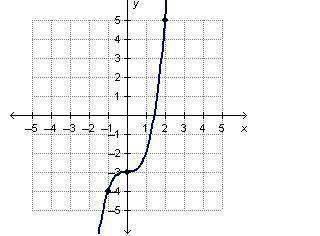
On a coordinate plane, a graph increases through (negative 1, 4), levels off at (0, negative 3), and then increases up through (2, 5).
Leslie analyzed the graph to determine if the function it represents is linear or non-linear. First she found three points on the graph to be (–1, –4), (0, -3), and (2, 5). Next, she determined the rate of change between the points (–1, –4) and (0, -3) to be StartFraction negative 3 minus (negative 4) Over 0 minus (negative 1) EndFraction = StartFraction 1 Over 1 EndFraction = 1. and the rate of change between the points (0, -3) and (2, 5) to be StartFraction 5 minus (negative 3) Over 2 minus 0 EndFraction = StartFraction 8 Over 2 EndFraction = 4. Finally, she concluded that since the rate of change is not constant, the function must be linear. Why is Leslie wrong?

Answers: 2


Other questions on the subject: Mathematics
Mathematics, 21.06.2019 15:30, carriecarl3530
State whether weight is a function of height for the six students and explain. a. yes, height is a function of weight because two students weigh 165 pounds but have different heights. b. no, height is not a function of weight because two students weigh 165 pounds but have different heights. c. yes, weight is a function of height because for each value of height there is one corresponding value of weight. d. no, weight is not a function of height because there is not enough data to determine a function.
Answers: 1
Mathematics, 22.06.2019 00:00, berliedecius4051
Answer this question i need as soon as possible
Answers: 1
You know the right answer?
Look at the graph.
On a coordinate plane, a graph increases through (negative 1, 4), levels off at...
Questions in other subjects:

Biology, 05.05.2020 23:28

History, 05.05.2020 23:28

Mathematics, 05.05.2020 23:28
Mathematics, 05.05.2020 23:28


