
Mathematics, 29.11.2020 19:50 OnlyaBurden
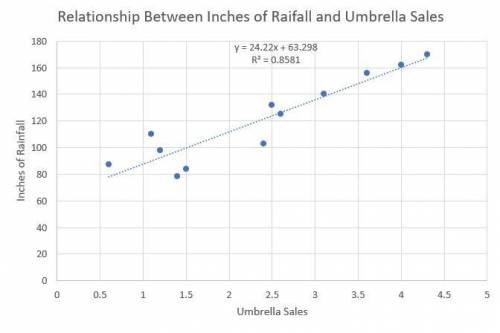
25 POINTS I WILL GIVE BRAINLIEST Patty’s Parasols recorded the monthly rainfall and their umbrella sales for an entire year. The following table shows the inches of rainfall and the number of umbrellas the store sold each month. The relationship between the inches of rainfall and umbrella sales can be modeled using a linear function. Month Jan. Feb. Mar. Apr. May Jun. Jul. Aug. Sept. Oct. Nov. Dec. Rainfall (in.) 2.5 3.1 4.0 4.3 3.6 2.4 1.2 0.6 1.5 1.4 1.1 2.6 Umbrella sales 132 140 162 170 156 103 98 87 84 78 110 125 (a) Using technology, determine the correlation coefficient for the data to the nearest hundredth. Explain the steps you used. (b) What does the correlation coefficient for the data indicate about the direction and strength of the linear association between the monthly rainfall and the number of umbrellas sold?

Answers: 3


Other questions on the subject: Mathematics
Mathematics, 21.06.2019 12:30, Tayannamorgan2373
Mercury poisoning is dangerous overload of mercury within the body. a major source of mercury within the body, a major source of mercury poisoning is consuming fish that contain mercury. certain fish are more prone to having higher levels of mercury than others. the pie chart shows the distribution of four breeds of fish at a hatchery. the hatchery has approximately 6,000 fish. a biologist from the centers for disease control and prevention randomly test 5% of each breed of fish for mercury content. her findings are shown in the following table. based on the biologist's findings, if a single salmon is randomly selected from those that were tested, what is the probability that this particular fish would have a dangerous mercury level? a) 0.001 b) 0.004 c) 0.02 d) 0.08
Answers: 1
Mathematics, 21.06.2019 20:00, chantelljenkins2
True or false: the graph of y=f(bx) is a horizontal compression of the graph y=f(x) if b< 1
Answers: 2
Mathematics, 21.06.2019 20:30, daniiltemkin20
List x1, x2, x3, x4 where xi is the left endpoint of the four equal intervals used to estimate the area under the curve of f(x) between x = 4 and x = 6. a 4, 4.5, 5, 5.5 b 4.5, 5, 5.5, 6 c 4.25, 4.75, 5.25, 5.75 d 4, 4.2, 5.4, 6
Answers: 1
Mathematics, 21.06.2019 23:00, kj44
Each of the following data sets has a mean of x = 10. (i) 8 9 10 11 12 (ii) 7 9 10 11 13 (iii) 7 8 10 12 13 (a) without doing any computations, order the data sets according to increasing value of standard deviations. (i), (iii), (ii) (ii), (i), (iii) (iii), (i), (ii) (iii), (ii), (i) (i), (ii), (iii) (ii), (iii), (i) (b) why do you expect the difference in standard deviations between data sets (i) and (ii) to be greater than the difference in standard deviations between data sets (ii) and (iii)? hint: consider how much the data in the respective sets differ from the mean. the data change between data sets (i) and (ii) increased the squared difference îł(x - x)2 by more than data sets (ii) and (iii). the data change between data sets (ii) and (iii) increased the squared difference îł(x - x)2 by more than data sets (i) and (ii). the data change between data sets (i) and (ii) decreased the squared difference îł(x - x)2 by more than data sets (ii) and (iii). none of the above
Answers: 2
You know the right answer?
25 POINTS I WILL GIVE BRAINLIEST Patty’s Parasols recorded the monthly rainfall and their umbrella s...
Questions in other subjects:


History, 15.07.2019 07:00


Biology, 15.07.2019 07:00
Biology, 15.07.2019 07:00


