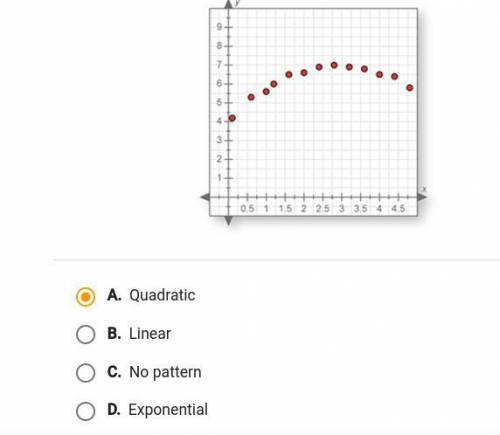
By visual inspection, determine the best-fitting regression model for the data plot below.
...

Mathematics, 29.11.2020 06:50 jourdanpress
By visual inspection, determine the best-fitting regression model for the data plot below.

Answers: 2


Other questions on the subject: Mathematics
Mathematics, 21.06.2019 20:30, lcy1086526Lisa1026
25) 56(1) = 5b a. identity property of addition b. identity property of multiplication c. commutative property of multiplication d. commutative property of addition
Answers: 1
Mathematics, 22.06.2019 00:00, emmagbales
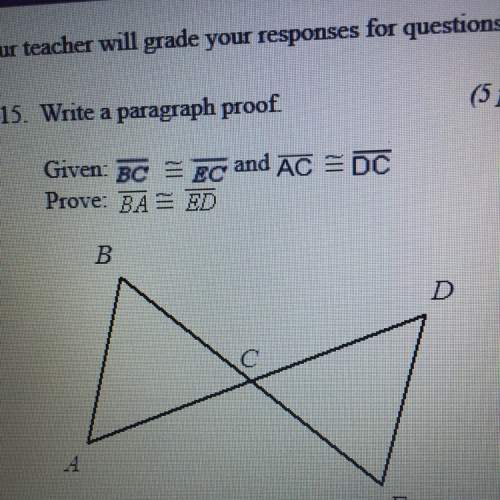
Given the diagram below, michael writes, "segment ac is congruent to segment ac." which of the following reasons allow him to write this statement?
Answers: 1
Mathematics, 22.06.2019 03:00, mmcdaniels46867
Aquality characteristic of new iphone x made at the amsterdam plant at apple computers has a manufacturing specification (in mm) of 0.200 +/- .07. historical data indicates that if the quality characteristic takes on values greater than 0.27 or smaller than 0.13 the component fails at a cost of20.19. based on these data: determine the taguchi loss function (must show work) calculate an estimated loss for a quality characteristic of .30 calculate an estimated loss for quality characteristic of .40.
Answers: 2
You know the right answer?
Questions in other subjects:


