Which inequality does the graph represent?
A. y −x − 3
B. y > −x − 3
C. y...

Mathematics, 28.11.2020 22:30 nsgtritent
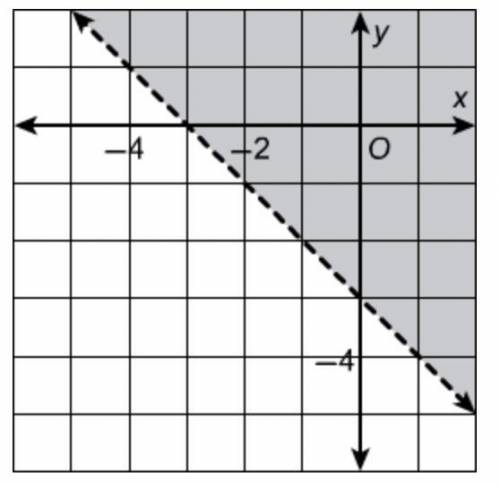
Which inequality does the graph represent?
A. y −x − 3
B. y > −x − 3
C. y ≤ −x − 3
D. y ≥ −x − 3

Answers: 1


Other questions on the subject: Mathematics
Mathematics, 21.06.2019 17:30, amiechap12
Let f(x) = x+3 and g(x) = 1/x the graph of (fog)(x) is shown below what is the range of (fog)(x)?
Answers: 2
Mathematics, 21.06.2019 23:30, isabel2417
Which equation represents a direct linear variationa. y=x2b. y=2/5xc. y=1/xd. y=x+3
Answers: 3
Mathematics, 22.06.2019 01:50, lcyaire
Me asap the graph shows the relationship between the price of frozen yogurt and the number of ounces of frozen yogurt sold at different stores and restaurants according to the line of best fit about how many ounces of frozen yogurt can someone purchase for $5? 1 cost of frozen yogurt 1.5 2 13 15.5 cost (5) no 2 4 6 8 10 12 14 16 18 20 size (oz)
Answers: 1
You know the right answer?
Questions in other subjects:

History, 08.12.2021 01:30

English, 08.12.2021 01:30
Mathematics, 08.12.2021 01:30


Health, 08.12.2021 01:30


