
Mathematics, 27.11.2020 06:40 ten55
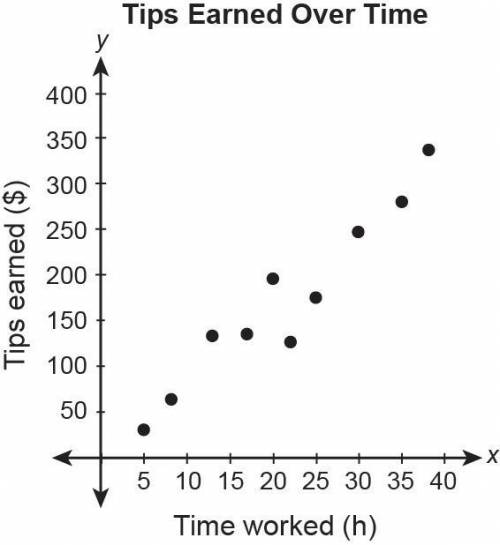
This scatter plot shows the amount of tips earned and hours worked.
Choose the statement that is best supported by the data in the scatter plot.
The data shows a non-linear association between the number of hours worked and tips earned.
The data shows no apparent association between the number of hours worked and tips earned.
The data shows a positive linear association between the number of hours worked and tips earned.
The data shows a negative linear association between the number of hours worked and tips earned.

Answers: 3


Other questions on the subject: Mathematics
Mathematics, 22.06.2019 01:00, mimithurmond03
Find the unit rate. enter your answer as a mixed number. a fertilizer covers 2/3 square foot in 1/2 hour.
Answers: 2
You know the right answer?
This scatter plot shows the amount of tips earned and hours worked.
Choose the statement that is be...
Questions in other subjects:


English, 24.09.2019 11:00

Business, 24.09.2019 11:00
History, 24.09.2019 11:00
Mathematics, 24.09.2019 11:00


