
Mathematics, 26.11.2020 01:00 lahebra
Determine if the following graphs and tables represent
proportional or non-proportional relationships. To break
the code each proportional relationship has a value of 2
and each non-proportional relationship has a value of 3.
Find the product of all the examples to break the code!
1)
4)
х
у
0
0
1
2
2
4.
5)
х
у
2
14
3
21
4
28
3)
6)
х
y
1
3
2
8
3
10
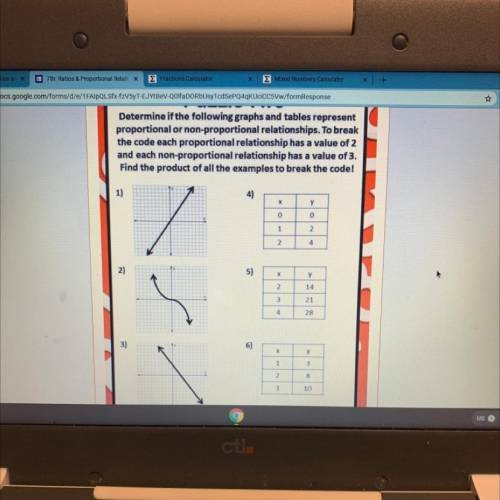

Answers: 3


Other questions on the subject: Mathematics
Mathematics, 21.06.2019 20:30, shelbylynn17
The function show two sisters' savings account and the rate at which they plan to deposit money
Answers: 3
Mathematics, 21.06.2019 22:30, murdocksfamilyouoxvm
Adeposit of 5500 at 6% for 3 years equals
Answers: 2
Mathematics, 21.06.2019 22:30, glstephens04
What is the point of inflection for the function f(x)=2cos4x on the interval (0, pi/2)
Answers: 2
You know the right answer?
Determine if the following graphs and tables represent
proportional or non-proportional relationshi...
Questions in other subjects:


Mathematics, 28.06.2021 20:20

Geography, 28.06.2021 20:20
Business, 28.06.2021 20:20

Mathematics, 28.06.2021 20:20


