y=3x

Mathematics, 25.11.2020 20:30 clairajogriggsk
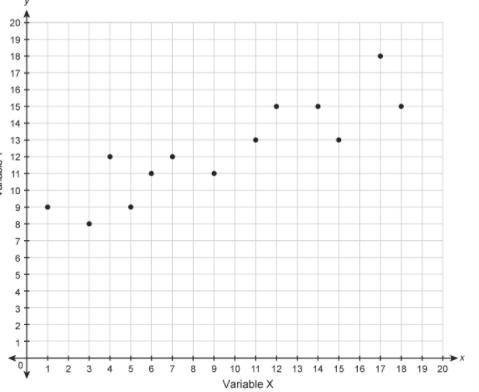
Which equation could represent the relationship shown in the scatter plot?
y=52x−1
y=3x
y=12x+7
y=−x+8
Scatter plot with x axis labeled variable x and y axis labeled variable y. Points go from lower left to upper right.

Answers: 1


Other questions on the subject: Mathematics
Mathematics, 21.06.2019 19:30, morganamandro9437
[15 points]find the quotient with the restrictions. (x^2 - 2x - 3) (x^2 + 4x + 3) ÷ (x^2 + 2x - 8) (x^2 + 6x + 8)
Answers: 1
You know the right answer?
Which equation could represent the relationship shown in the scatter plot?
y=52x−1
y=3x
y=3x
Questions in other subjects:


Mathematics, 18.12.2020 08:10

Biology, 18.12.2020 08:10

Chemistry, 18.12.2020 08:10

Social Studies, 18.12.2020 08:10
Social Studies, 18.12.2020 08:10


