
Mathematics, 24.11.2020 23:40 angoliabirtio
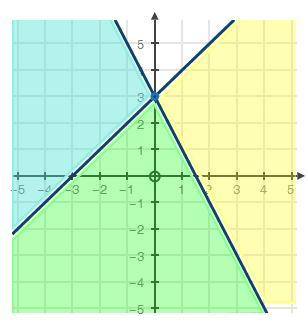
The graph below represents which system of inequalities? (2 points) graph of two infinite lines that intersect at a point. One line is solid and goes through the points negative 3, 0, negative 4, negative 1 and is shaded in below the line. The other line is solid, and goes through the points 1, 1, 2, negative 1 and is shaded in below the line.
A) y ≤ −2x + 3
y ≤ x + 3
B) y ≥ −2x + 3
y ≥ x + 3
C) y ≤ −3x + 2
y ≤ −x + 2
D) y > −2x + 3
y > x + 3

Answers: 3


Other questions on the subject: Mathematics
Mathematics, 21.06.2019 18:00, dizzleman3030
Find the perimeter of the figure shown above. a. 40 cm c. 52 cm b. 60 cm d. 75 cm select the best answer from the choices provided
Answers: 1
You know the right answer?
The graph below represents which system of inequalities? (2 points) graph of two infinite lines that...
Questions in other subjects:


Biology, 17.09.2019 10:10

Physics, 17.09.2019 10:10

Social Studies, 17.09.2019 10:10

History, 17.09.2019 10:10


