
Mathematics, 24.11.2020 23:10 Lonzo2
I NEED HELP ASAP
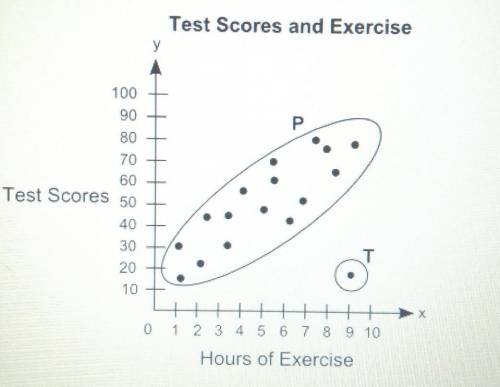
The scatter plot shows the relationship between the test scores of a group of students and the number of hours they exercise in a week:
Part A: What is the group of points labeled P called? What is the point labeled T called? Give a possible reason for the presence of point T.
Part B: Describe the association between students' test scores and the number of hours they exercise.

Answers: 3


Other questions on the subject: Mathematics
Mathematics, 21.06.2019 19:30, iloading5117
Carlos spent 1 1/4 hours doing his math homework he spent 1/4 of his time practicing his multiplication facts how many hours to carlos been practicing his multiplication facts
Answers: 2
Mathematics, 22.06.2019 03:00, familygrahambusiness
Atest of sobriety involves measuring the subject's motor skills. a sample of 31 randomly selected sober subjects take the test and produce a mean score of 64.4 with a standard deviation of 2. a claim is made that the true mean score for all sober subjects is equal to 65. for each part below, enter only a numeric value in the answer box. for example, do not type "z =" or "t =" before your answers. round each of your answers to 3 places after the decimal point. (a) calculate the value of the test statistic used in this test. test statistic's value = (b) use your calculator to find the p-value of this test. p-value = (c) use your calculator to find the critical value(s) used to test this claim at the 0.2 significance level. if there are two critical values, then list them both with a comma between them. critical value(s) =
Answers: 2
Mathematics, 22.06.2019 03:30, madison1284
On a certain portion of an experiment, a statistical test result yielded a p-value of 0.21. what can you conclude? 2(0.21) = 0.42 < 0.5; the test is not statistically significant. if the null hypothesis is true, one could expect to get a test statistic at least as extreme as that observed 21% of the time, so the test is not statistically significant. 0.21 > 0.05; the test is statistically significant. if the null hypothesis is true, one could expect to get a test statistic at least as extreme as that observed 79% of the time, so the test is not statistically significant. p = 1 - 0.21 = 0.79 > 0.05; the test is statistically significant.
Answers: 3
You know the right answer?
I NEED HELP ASAP
The scatter plot shows the relationship between the test scores of a group of stud...
Questions in other subjects:


Chemistry, 03.08.2019 18:00


Biology, 03.08.2019 18:00
History, 03.08.2019 18:00

Chemistry, 03.08.2019 18:00


