Which inequality has a solid boundary line when graphed?
a. y< -x-9
b. y< 1/9x+9<...

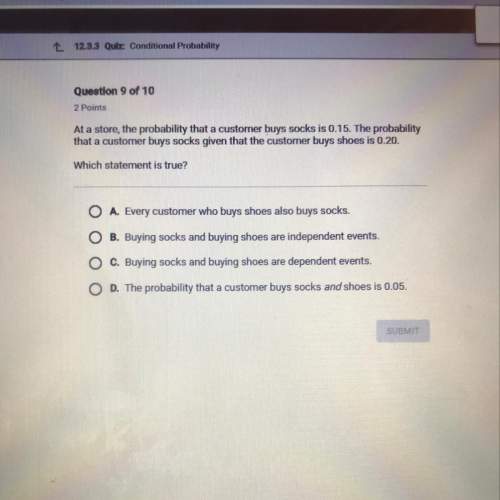
Mathematics, 17.09.2019 20:50 abhibhambhani
Which inequality has a solid boundary line when graphed?
a. y< -x-9
b. y< 1/9x+9
c. y> -1/9x
d. y> _9x+9

Answers: 2


Other questions on the subject: Mathematics
Mathematics, 21.06.2019 15:00, Shavaila18
The data shown in the table below represents the weight, in pounds, of a little girl, recorded each year on her birthday. age (in years) weight (in pounds) 2 32 6 47 7 51 4 40 5 43 3 38 8 60 1 23 part a: create a scatter plot to represent the data shown above. sketch the line of best fit. label at least three specific points on the graph that the line passes through. also include the correct labels on the x-axis and y-axis. part b: algebraically write the equation of the best fit line in slope-intercept form. include all of your calculations in your final answer. part c: use the equation for the line of best fit to approximate the weight of the little girl at an age of 14 years old.
Answers: 3
Mathematics, 21.06.2019 19:30, kataldaine
Which of the following describes the symmetry of the graph of y = x3?
Answers: 2
Mathematics, 21.06.2019 20:30, nayelieangueira
Kyle and elijah are planning a road trip to california. their car travels 3/4 of a mile per min. if they did not stop driving, how many miles could kyle and elijah drove in a whole day? ? 1 day = 24 hours. plzzz write a proportion i will give you 100 points
Answers: 1
You know the right answer?
Questions in other subjects:

Biology, 04.02.2020 05:47
Mathematics, 04.02.2020 05:47

Chemistry, 04.02.2020 05:47

Social Studies, 04.02.2020 05:47


