The table represents a proportional relationship.
xy
112
224
336
The graph...

Mathematics, 24.11.2020 18:50 cecelia090
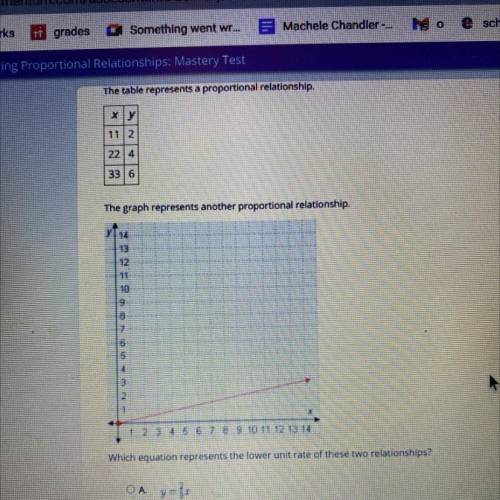
The table represents a proportional relationship.
xy
112
224
336
The graph represents another proportional relationship,
y 14
13
12
11
-10
9
7
15
5
2
1
1 2 3 4 5 6 7 8 9 10 11 12 13 14
Which equation represents the lower unit rate of these two relationships?
OA = }
OB.
ocy=$1
OD.
y 11"

Answers: 1


Other questions on the subject: Mathematics
Mathematics, 21.06.2019 15:00, gghkooo1987
This is the number of parts out of 100, the numerator of a fraction where the denominator is 100. submit
Answers: 3
Mathematics, 21.06.2019 15:30, jose4197
It takes a total of 6 hours to fill up an inground backyard pool using a standard house. a function can represent this situation to represent the amount of water in the pool until it is full a function of time the hose is running. determine the domain for the function
Answers: 1
Mathematics, 21.06.2019 21:30, kimlyn58p0wyn0
The price of a dozen eggs was $1.63. suppose the price increases m dollars per dozen and then the price decreases $0.12 per dozen. which expression represents the current price of eggs after the two price changes?
Answers: 1
You know the right answer?
Questions in other subjects:

Mathematics, 11.01.2021 18:40
Mathematics, 11.01.2021 18:40

Social Studies, 11.01.2021 18:40


Mathematics, 11.01.2021 18:40


