40 Points
Overlapping Dot Plots
A researcher uses a program that plots two sets of data...

Mathematics, 24.11.2020 18:30 makennahudson94
40 Points
Overlapping Dot Plots
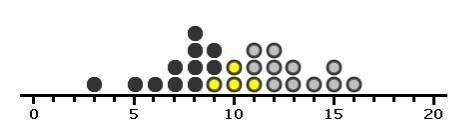
A researcher uses a program that plots two sets of data on the same number line in order to highlight overlapping data points, such as in the example below.
from "Overlapping Dot Plots"
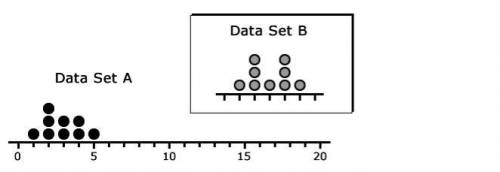
Having plotted data set A, she will now plot data set B (shaped as shown when plotted correctly). If the mean of data set B is 6, how many data points will overlap when both sets are plotted together?
(The first picture is the background info, the second picture is for the question)

Answers: 1


Other questions on the subject: Mathematics
Mathematics, 21.06.2019 13:00, innocentman69
You are constructing a histogram for scores that range from 70 to 100 in whole points. frequencies range from 3 to 10; that is, every whole-point score between 60 and 100 occurs at least 3 times, and at least one score occurs 10 times. which of these would probably be the best range and size for the score intervals along the x-axis?
Answers: 1
Mathematics, 21.06.2019 17:20, polarbear3787
Which system of linear inequalities is represented by the graph? x-3y > 6 and y? 2x + 4 x + 3y > 6 and y? 2x - 4 x - 3y > 6 and y? 2 - 4 x + 3y > 6 and y > 2x + 4 no be 2 -1.1 1 2 3 4 5 submit save and exit next mark this and retum be
Answers: 1
Mathematics, 21.06.2019 22:00, jamarstand
What is the equation of the line that is parallel to the line with the equation y= -3/4x +1 and passes through the point (12,-12)
Answers: 1
Mathematics, 22.06.2019 05:00, shannydouglas
If you apply the changes below to the linear parent function .f(x)=x what is the equation of the new function ? vertically stretch by a factor of 3 ; flip over the x axis
Answers: 3
You know the right answer?
Questions in other subjects:

History, 09.07.2019 15:00
History, 09.07.2019 15:00


Social Studies, 09.07.2019 15:00
History, 09.07.2019 15:00

Mathematics, 09.07.2019 15:00
Mathematics, 09.07.2019 15:00


