
Mathematics, 23.11.2020 20:10 marlesly87
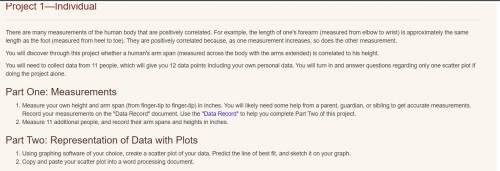
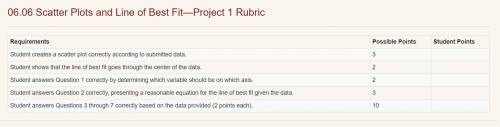
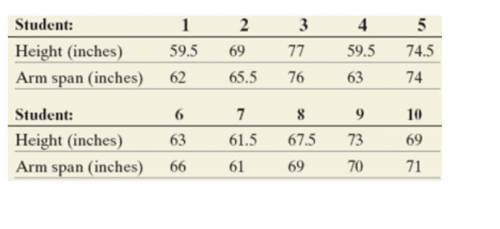
(All of the data to solve this will be linked inside of the photos below, i also included a rubric, please follow the rubric and explain each answer because im giving a lot of points for this, also i dont want to just copy and paste it.. im having trouble with this because i dont understand it, if you could explain it as best as you can that would be greatly appreciated)
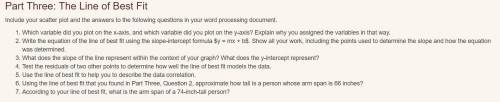
1. Which variable did you plot on the x-axis, and which variable did you plot on the y-axis? Explain why you assigned the variables in that way.
2. Write the equation of the line of best fit using the slope-intercept formula $y = mx + b$.
To find Y we need to do y2-y1/x2-x1 the variables will be two points that line up on our graph
3. What does the slope of the line represent within the context of your graph? What does the y-intercept represent?
4. Test the residuals of two other points to determine how well the line of best fit models the data. Use the line of best fit to help you to describe the data correlation.
5. Using the line of best fit that you found in Part Three, Question 2, approximate how tall is a person whose arm span is 66 inches?
6. According to your line of best fit, what is the arm span of a 74-inch-tall person?

Answers: 2


Other questions on the subject: Mathematics
Mathematics, 21.06.2019 17:00, hsernaykaw42
Use the frequency distribution, which shows the number of american voters (in millions) according to age, to find the probability that a voter chosen at random is in the 18 to 20 years old age range. ages frequency 18 to 20 5.9 21 to 24 7.7 25 to 34 20.4 35 to 44 25.1 45 to 64 54.4 65 and over 27.7 the probability that a voter chosen at random is in the 18 to 20 years old age range is nothing. (round to three decimal places as needed.)
Answers: 1
Mathematics, 21.06.2019 19:30, keidyhernandezm
Consider that lines b and c are parallel. what is the value of x? what is the measure of the smaller angle?
Answers: 1
Mathematics, 21.06.2019 23:00, snot1766p5flsr
Over the course of a month, a person's weight decreases. what type of relationship is this? a. positive relationship
Answers: 3
You know the right answer?
(All of the data to solve this will be linked inside of the photos below, i also included a rubric,...
Questions in other subjects:
Mathematics, 09.08.2019 05:10

English, 09.08.2019 05:10
Mathematics, 09.08.2019 05:10

History, 09.08.2019 05:10
Mathematics, 09.08.2019 05:10
Mathematics, 09.08.2019 05:10
Mathematics, 09.08.2019 05:10


