
Mathematics, 23.11.2020 17:50 chammusa2
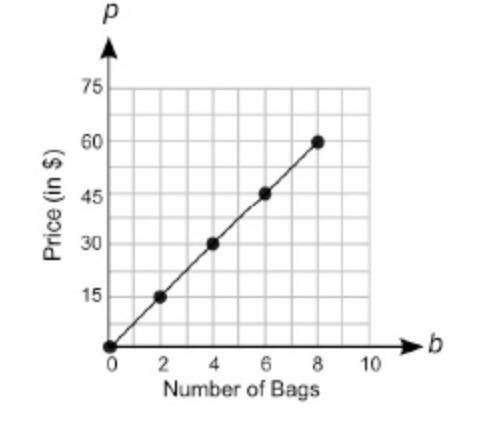
The graph below shows the price of different numbers of swim bags at a store:
A graph is shown. The values on the x axis are 0, 2, 4, 6, 8, 10. The values on the y axis are 0, 15, 30, 45, 60, and 75. Points are shown on ordered pairs 0, 0 and 2, 15 and 4, 30 and 6, 45 and 8, 60. These points are connected by a line. The label on the x axis is Number of Bags. The title on the y axis is Price in dollars.
Which equation can be used to determine p, the cost of b swim bags? (5 points)
Group of answer choices
p = 7.50 + b
b = 7.50 + p
p = 7.50b
b = 7.50p

Answers: 3


Other questions on the subject: Mathematics
Mathematics, 21.06.2019 19:30, jrassicworld4ever
Need now max recorded the heights of 500 male humans. he found that the heights were normally distributed around a mean of 177 centimeters. which statements about max’s data must be true? a) the median of max’s data is 250 b) more than half of the data points max recorded were 177 centimeters. c) a data point chosen at random is as likely to be above the mean as it is to be below the mean. d) every height within three standard deviations of the mean is equally likely to be chosen if a data point is selected at random.
Answers: 1
Mathematics, 21.06.2019 21:30, fheight01
Name and describe the three most important measures of central tendency. choose the correct answer below. a. the mean, sample size, and mode are the most important measures of central tendency. the mean of a data set is the sum of the observations divided by the middle value in its ordered list. the sample size of a data set is the number of observations. the mode of a data set is its highest value in its ordered list. b. the sample size, median, and mode are the most important measures of central tendency. the sample size of a data set is the difference between the highest value and lowest value in its ordered list. the median of a data set is its most frequently occurring value. the mode of a data set is sum of the observations divided by the number of observations. c. the mean, median, and mode are the most important measures of central tendency. the mean of a data set is the product of the observations divided by the number of observations. the median of a data set is the lowest value in its ordered list. the mode of a data set is its least frequently occurring value. d. the mean, median, and mode are the most important measures of central tendency. the mean of a data set is its arithmetic average. the median of a data set is the middle value in its ordered list. the mode of a data set is its most frequently occurring value.
Answers: 3
Mathematics, 21.06.2019 23:50, obrunelle4678
Solve for x in the equation x2 - 12x + 36 = 90. x= 6+3x/10 x=6+2/7 x= 12+3/22 x = 12+3/10
Answers: 2
You know the right answer?
The graph below shows the price of different numbers of swim bags at a store:
A graph is shown. The...
Questions in other subjects:


Mathematics, 22.09.2019 16:10

History, 22.09.2019 16:10


