
Mathematics, 21.11.2020 02:20 Fahaddie
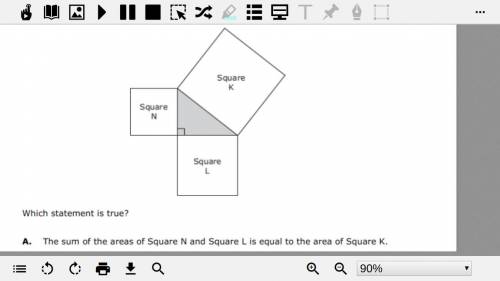
The diagram shows three squares that are joined at vertices to form a right triangle. Which statement is true?
A. The sum of the areas of Square N and Square L is equal to the area of Square K.
B. The sum of the areas of Square N and Square L is greater than the area of Square K.
C. The sum of the areas of Square N and Square K is equal to the area of Square L.
D. The sum of the areas of Square N and Square K is less than the area of Square L.

Answers: 3


Other questions on the subject: Mathematics
Mathematics, 21.06.2019 19:00, Patricia2121
Me with geometry ! in this figure, bc is a perpendicular bisects of kj. dm is the angle bisects of bdj. what is the measure of bdm? •60° •90° •30° •45°
Answers: 2
Mathematics, 21.06.2019 19:00, chloebaby8
Find the equation of a line whose slope is 2/5 and y- intercept is 2.write your answer in the form 1) ax+by+c=02) x/a+y/b=1
Answers: 1
Mathematics, 22.06.2019 01:00, s27511583
The weight of 46 new patients of a clinic from the year 2018 are recorded and listed below. construct a frequency distribution, using 7 classes. then, draw a histogram, a frequency polygon, and an ogive for the data, using the relative information from the frequency table for each of the graphs. describe the shape of the histogram. data set: 130 192 145 97 100 122 210 132 107 95 210 128 193 208 118 196 130 178 187 240 90 126 98 194 115 212 110 225 187 133 220 218 110 104 201 120 183 124 261 270 108 160 203 210 191 180 1) complete the frequency distribution table below (add as many rows as needed): - class limits - class boundaries - midpoint - frequency - cumulative frequency 2) histogram 3) frequency polygon 4) ogive
Answers: 1
You know the right answer?
The diagram shows three squares that are joined at vertices to form a right triangle. Which statemen...
Questions in other subjects:
Mathematics, 18.07.2019 06:40


History, 18.07.2019 06:40
Mathematics, 18.07.2019 06:40

English, 18.07.2019 06:40
Mathematics, 18.07.2019 06:40


