
Mathematics, 21.11.2020 01:00 dedrenabouyer
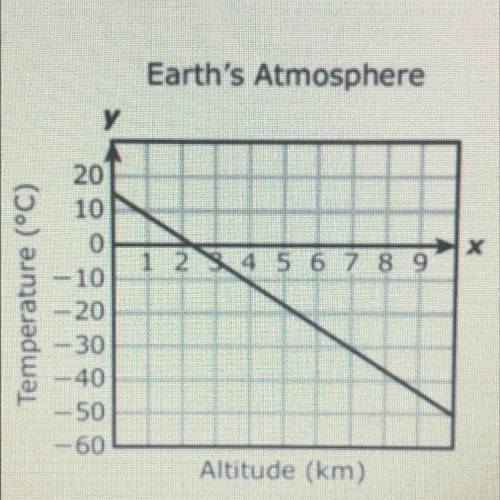
The graph models the linear relationship between the temperature of
Earth's atmosphere and the altitude above sea level. Which of these best
represents the rate of change of the temperature with respect to
altitude? *
A: -6.5*C/km
B: -3.5*C/km
C:-0.29*C/km
D:-0.15*C/km

Answers: 3


Other questions on the subject: Mathematics
Mathematics, 21.06.2019 23:30, rainbowboi
What is the simplified form of square root of 400 to the 100th power ?
Answers: 1
Mathematics, 22.06.2019 01:00, NNopeNNopeNNope
Bc and bd are opposite rays. all of the following are true except a)a, b,c, d are collinear b)a, b,c, d are coplanar c)bc=bd d)b is between c and d
Answers: 1
You know the right answer?
The graph models the linear relationship between the temperature of
Earth's atmosphere and the alti...
Questions in other subjects:


Computers and Technology, 24.01.2020 18:31


