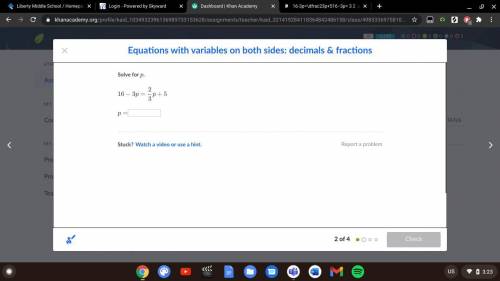
16-3p=\dfrac23p+516−3p=
3
2
p+5
...

Mathematics, 20.11.2020 23:50 cmikell124
16-3p=\dfrac23p+516−3p=
3
2
p+5

Answers: 3


Other questions on the subject: Mathematics
Mathematics, 21.06.2019 14:20, blakemccain1928
Which linear inequality is represented by the graph? !
Answers: 2
Mathematics, 21.06.2019 17:10, ivilkas23
The frequency table shows a set of data collected by a doctor for adult patients who were diagnosed with a strain of influenza. patients with influenza age range number of sick patients 25 to 29 30 to 34 35 to 39 40 to 45 which dot plot could represent the same data as the frequency table? patients with flu
Answers: 2
Mathematics, 21.06.2019 20:00, gladysvergara
How does the graph of g(x)=⌊x⌋−3 differ from the graph of f(x)=⌊x⌋? the graph of g(x)=⌊x⌋−3 is the graph of f(x)=⌊x⌋ shifted right 3 units. the graph of g(x)=⌊x⌋−3 is the graph of f(x)=⌊x⌋ shifted up 3 units. the graph of g(x)=⌊x⌋−3 is the graph of f(x)=⌊x⌋ shifted down 3 units. the graph of g(x)=⌊x⌋−3 is the graph of f(x)=⌊x⌋ shifted left 3 units.
Answers: 1
Mathematics, 21.06.2019 22:00, hannahpalmario
The customer price index(cpi), which measures the cost of a typical package of customer goods, was 208.8 in 2011 and 244.1 in 2016.let x=11 corresponding to the year 2011 an estimate to cpi into 2013 and 2014. assume that the data can be modeled by a straight line and the trend to continue idenfinitely. use data points to find such a line and then estimate the requested quantities
Answers: 1
You know the right answer?
Questions in other subjects:

Physics, 31.01.2020 08:02


Chemistry, 31.01.2020 08:02
Mathematics, 31.01.2020 08:02

French, 31.01.2020 08:02


