
Mathematics, 20.11.2020 23:00 shonnap1
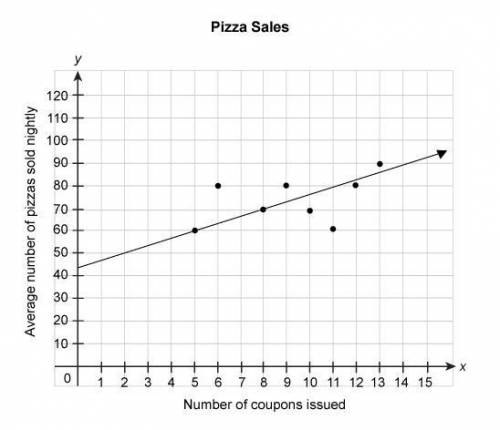
The scatter plot below shows the number of pizzas sold during weeks when different numbers of coupons were issued. The equation represents the linear model for this data.
y = 3.4x + 43
According to the model, how many pizzas will be sold nightly if 15 coupons are issued?
Enter your answer in the box.
# of pizzas_

Answers: 2


Other questions on the subject: Mathematics
Mathematics, 21.06.2019 19:00, eparikh7317
Rob spent 25%, percent more time on his research project than he had planned. he spent an extra h hours on the project. which of the following expressions could represent the number of hours rob actually spent on the project? two answers
Answers: 1
You know the right answer?
The scatter plot below shows the number of pizzas sold during weeks when different numbers of coupon...
Questions in other subjects:


Mathematics, 08.12.2019 04:31

History, 08.12.2019 04:31


Mathematics, 08.12.2019 04:31

Physics, 08.12.2019 04:31


