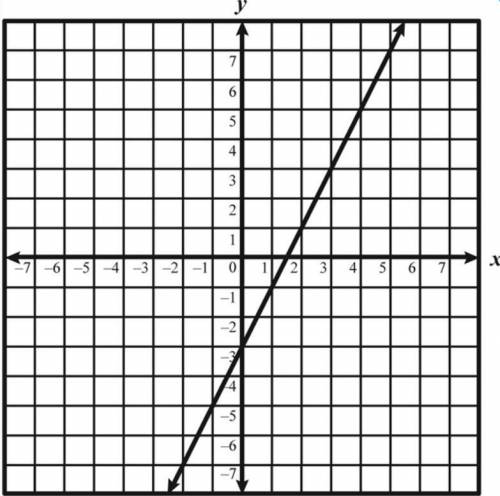
Which of these equations represents the graph below?
y = 2x + 3
y = 3x - 2
y...

Mathematics, 20.11.2020 18:40 franklinkaylieg1145
Which of these equations represents the graph below?
y = 2x + 3
y = 3x - 2
y = 3x + 2
y=2x - 3

Answers: 3


Other questions on the subject: Mathematics
Mathematics, 21.06.2019 16:00, jeff7259
The scatter plot graph shows the average annual income for a certain profession based on the number of years of experience which of the following is most likely to be the equation of the trend line for this set of data? a. i=5350e +37100 b. i=5350e-37100 c. i=5350e d. e=5350e+37100
Answers: 1
Mathematics, 21.06.2019 20:30, phillipfruge3
East black horse $0.25 total budget is $555 it'll cost $115 for other supplies about how many flyers do you think we can buy
Answers: 1
Mathematics, 21.06.2019 20:30, celestesanchezts
8. kelly wants to buy a magazine that is $25. later the magazine was marked up an additional 20%. what is the new price?
Answers: 1
Mathematics, 21.06.2019 21:30, jstringe424
This is a map of the mars exploration rover opportunity predicted landing site on mars. the scale is 1cm : 9.4km. what are the approximate measures of the actual length and width of the ellipse? i mostly need to know how to set it up : )
Answers: 3
You know the right answer?
Questions in other subjects:


Arts, 09.02.2021 01:30
Mathematics, 09.02.2021 01:30

Computers and Technology, 09.02.2021 01:30


