
Mathematics, 20.11.2020 05:00 janelisse199820
Please help me I will give you the brain thing and extra points, image below for graph.
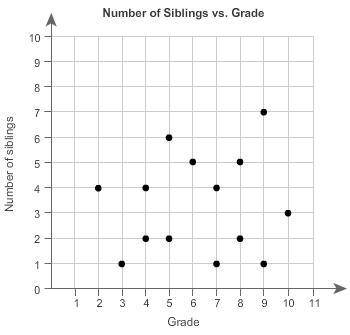
This scatter plot shows the number of siblings 14 students have and each student's grade level.
Choose the conclusion that is best supported by the data shown in the scatter plot.
There is no relationship between grade level and the number of siblings each student has.
As grade level increases, the number of siblings each student has decreases.
As grade level increases, the number of siblings each student has stays the same.
As grade level increases, the number of siblings each student has increases.

Answers: 2


Other questions on the subject: Mathematics
Mathematics, 22.06.2019 01:00, allysongonzalezlove0
Ineed to know how to write question one in mathematical terms
Answers: 1
You know the right answer?
Please help me I will give you the brain thing and extra points, image below for graph.
This scatte...
Questions in other subjects:

Biology, 24.07.2019 08:40

Mathematics, 24.07.2019 08:40

Chemistry, 24.07.2019 08:40
Biology, 24.07.2019 08:40

Biology, 24.07.2019 08:40
Chemistry, 24.07.2019 08:40


