Mathematics, 19.11.2020 21:40 zack66828
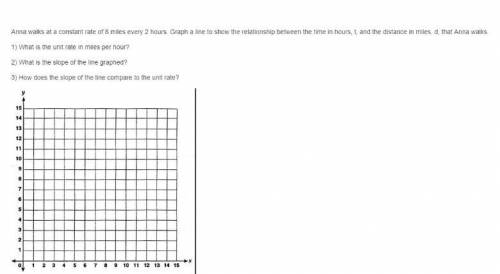
Anna walks at a constant rate of 8 miles every 2 hours Graph a line to show the relationship between the time in hours, 1 and the distance in miles, d, that Anna walks
1) What is the unit rate in miles per hour?
2) What is the slope of the line graphed?
3) How does the slope of the line compare to the unit rate?


Answers: 3


Other questions on the subject: Mathematics

Mathematics, 21.06.2019 20:00, faithyholcomb
Someone answer asap for ! max recorded the heights of 500 male humans. he found that the heights were normally distributed around a mean of 177 centimeters. which statements about max’s data must be true? a. the median of max’s data is 250 b. more than half of the data points max recorded were 177 centimeters. c. a data point chosen at random is as likely to be above the mean as it is to be below the mean. d. every height within three standard deviations of the mean is equally likely to be chosen if a data point is selected at random.
Answers: 1

Mathematics, 21.06.2019 20:30, elijah4723
1) you deposit $2,500 in an account that earns 4% simple interest. how much do you earn in eight years?
Answers: 1

Mathematics, 21.06.2019 21:00, kharmaculpepper
Joanie watched 1 out of three of a movie in the morning
Answers: 1
You know the right answer?
Anna walks at a constant rate of 8 miles every 2 hours Graph a line to show the relationship between...
Questions in other subjects:

Physics, 15.08.2020 14:01


Mathematics, 15.08.2020 14:01


Mathematics, 15.08.2020 14:01


