What does the graph show?
A. Every hour, 3 miles is traveled
B. The graph starts at 3 miles.<...

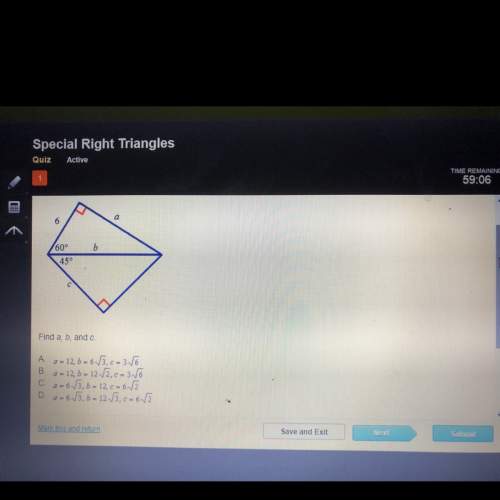
Mathematics, 19.11.2020 14:00 jerenasmith77
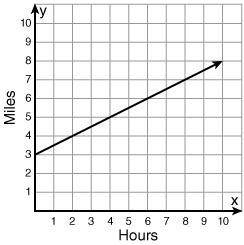
What does the graph show?
A. Every hour, 3 miles is traveled
B. The graph starts at 3 miles.
C. After 8 hours, the distance is 7 miles.
D. Every 2 hours, 1 mile is traveled.
you can choose more than one answer.

Answers: 3


Other questions on the subject: Mathematics
Mathematics, 21.06.2019 14:40, offensiveneedle
1. what is the phythaforean theorem? 2.what do we use it for? 1.what is the distance formula ? 2.what do we use it for?
Answers: 2
Mathematics, 21.06.2019 15:00, sierravick123owr441
1. a right triangle is graphed on a coordinate plane. find the length of the hypotenuse. round your answer to the nearest tenth. 2. use the angle relationship in the figure below to solve for the value of x. assume that lines a and b are parallel and line c is a transversal.
Answers: 1
Mathematics, 21.06.2019 16:30, skylarjohnson2683
What is true about the dilation? it is a reduction with a scale factor between 0 and 1. it is a reduction with a scale factor greater than 1. it is an enlargement with a scale factor between 0 and 1. it is an enlargement with a scale factor greater than 1.
Answers: 2
You know the right answer?
Questions in other subjects:


Mathematics, 28.07.2020 23:01

Mathematics, 28.07.2020 23:01


