
Mathematics, 19.11.2020 01:50 genyjoannerubiera
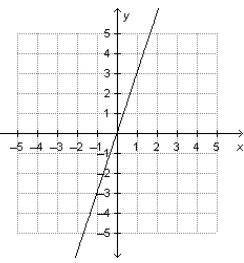
Which explains whether or not the graph represents a direct variation?
A. The graph has a constant of variation of 3, so it represents a direct variation.
B. The graph has a slope of 3, so it represents a direct variation.
C. The graph has a positive slope, so it does not represent a direct variation.
D. The graph does not begin at the origin, so it does not represent a direct variation.

Answers: 3


Other questions on the subject: Mathematics
Mathematics, 21.06.2019 16:30, elysabrina6697
Write each fraction as an equivalent fraction with a denominator of 120then write the original fractions in order from samllest to largest
Answers: 3
Mathematics, 21.06.2019 19:00, mbalderp5bxjo
Billy plotted −3 4 and −1 4 on a number line to determine that −3 4 is smaller than −1 4 is he correct? explain why or why not?
Answers: 3
Mathematics, 21.06.2019 20:50, xbeatdroperzx
Ms. ortiz sells tomatoes wholesale. the function p(x)=-80x^2+320x-10, graphed below, indicates how much profit she makes on a load of tomatoes if she makes on a load of tomatoes if she sells them for 4-x dollars per kilogram. what should ms. ortiz charge per kilogram of tomatoes to make on a load of tomatoes?
Answers: 2
You know the right answer?
Which explains whether or not the graph represents a direct variation?
A. The graph has a constant...
Questions in other subjects:

Mathematics, 07.11.2019 01:31

Biology, 07.11.2019 01:31


History, 07.11.2019 01:31


