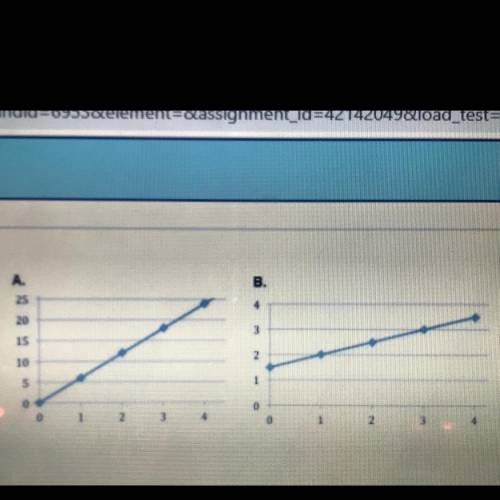
Which statement is true about the graphs shown?
A)
Only graph A represents a proportional rel...

Mathematics, 19.11.2020 01:00 tiarafaimealelei
Which statement is true about the graphs shown?
A)
Only graph A represents a proportional relationship.
B)
Only graph B represents a proportional relationship.
Graph A and graph B both represent a proportional relationship.
D)
Graph A and graph B both represent a non-proportional relationship

Answers: 2


Other questions on the subject: Mathematics
Mathematics, 21.06.2019 13:30, janeliles
Lassify the function as linear or quadratic and identify the quadratic, linear, and constant terms. f(x) = (3x + 2)(−6x − 3) linear function; linear term: −21x; constant term: −6 linear function; linear term: −18x2; constant term: −6 quadratic function; quadratic term: 6x2; linear term: 24x; constant term: −6 quadratic function; quadratic term: −18x2; linear term: −21x; constant term: −6
Answers: 3
Mathematics, 21.06.2019 22:00, Jasten
Set $r$ is a set of rectangles such that (1) only the grid points shown here are used as vertices, (2) all sides are vertical or horizontal and (3) no two rectangles in the set are congruent. if $r$ contains the maximum possible number of rectangles given these conditions, what fraction of the rectangles in set $r$ are squares? express your answer as a common fraction.
Answers: 1
You know the right answer?
Questions in other subjects:

Chemistry, 12.02.2021 14:00

Mathematics, 12.02.2021 14:00


