
Mathematics, 18.11.2020 22:50 Ezonthekid
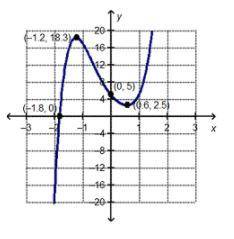
The graph of the function f(x) is shown below.
On a coordinate plane, a curved line with a minimum value of (0.6, 2.5) and a maximum value of (negative 1.2, 18.3), crosses the x-axis at (negative 1.8, 0) and crosses the y-axis at (0, 5).
NEED HELP ASAP!! PLEASE HELP
What is x when f(x)=0?
-1.8
-1.2
0
5

Answers: 2


Other questions on the subject: Mathematics
Mathematics, 21.06.2019 18:30, krystalhurst97
Find the constant of variation for the relation and use it to write an equation for the statement. then solve the equation.
Answers: 1
Mathematics, 21.06.2019 21:40, jacobasencio23
Use sigma notation to represent the following series for 9 terms.
Answers: 2
Mathematics, 21.06.2019 22:30, 1930isainunez
How can constraints be used to model a real-world situation?
Answers: 1
You know the right answer?
The graph of the function f(x) is shown below.
On a coordinate plane, a curved line with a minimum...
Questions in other subjects:


Computers and Technology, 23.06.2020 00:57

Geography, 23.06.2020 00:57

History, 23.06.2020 00:57

Chemistry, 23.06.2020 00:57
History, 23.06.2020 00:57
English, 23.06.2020 00:57


