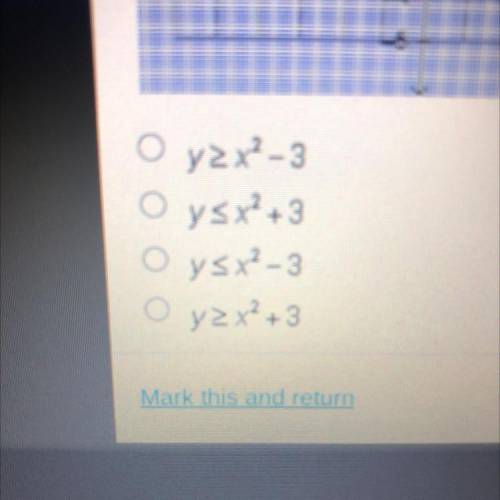
Which quadratic inequality does the graph below represent?
...

Mathematics, 18.11.2020 17:10 Ndow2
Which quadratic inequality does the graph below represent?

Answers: 1


Other questions on the subject: Mathematics
Mathematics, 21.06.2019 18:00, jedsgorditas
The los angels ram scored 26, 30, 48, and 31 pts in their last four games. how many pts do they need to score in super bowl liii in order to have an exact mean average of 35 pts over five games. write and solve and equation. use x to represent the 5th game.
Answers: 1
Mathematics, 21.06.2019 21:30, drepeter86
50 people men and women were asked if they watched at least one sport on tv. 20 of the people surveyed are women, but only 9 of them watch at least one sport on tv. 16 of the men watch at least one sport on tv. make a a two-way table and a relative frequency table to represent the data.
Answers: 3
You know the right answer?
Questions in other subjects:
Mathematics, 03.12.2019 03:31


Mathematics, 03.12.2019 03:31

Physics, 03.12.2019 03:31
History, 03.12.2019 03:31
English, 03.12.2019 03:31


