(05.01)
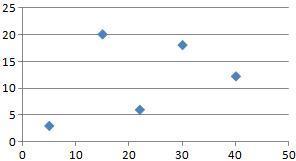
What is the slope of the line shown in the graph? (4 points)
A coordinate plane...

Mathematics, 18.11.2020 02:00 olivernolasco23
(05.01)
What is the slope of the line shown in the graph? (4 points)
A coordinate plane is shown with points graphed at 2 comma 2 and 0 comma 1. The points are joined by a line.
Group of answer choices
1 over 2
−1 over 2
−1
−2

Answers: 2


Other questions on the subject: Mathematics

Mathematics, 21.06.2019 15:20, heyrosaphoto3159
The speed of a falling object increases at a constant rate as time increases since the object was dropped. which graph could represent the relationship betweent time in seconds, and s, speed in meters per second? speed of a falling object object over time
Answers: 1


Mathematics, 21.06.2019 19:00, haileysolis5
Arestaurant chef made 1 1/2 jars of pasta sauce. each serving of pasta requires 1/2 of a jar of sauce. how many servings of pasta will the chef be bale to prepare using the sauce?
Answers: 3

Mathematics, 21.06.2019 22:10, cheryljoseph69
Asix-sided number cube is rolled twice. what is the probability that the first roll is an even numbe and the second roll is a number greater than 4?
Answers: 1
You know the right answer?
Questions in other subjects:


Arts, 19.02.2021 16:30


Mathematics, 19.02.2021 16:30


