
Mathematics, 17.11.2020 23:40 jackieeecx3
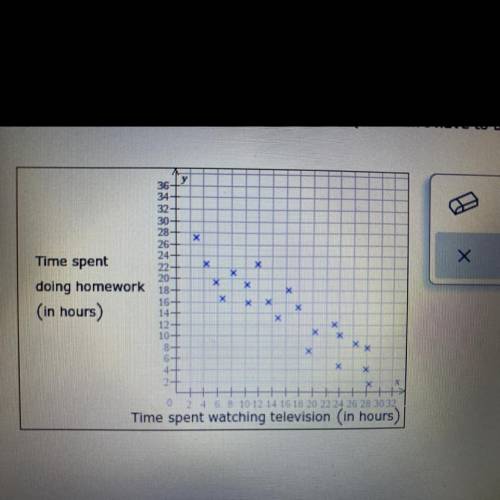
The data points on the scatter plot below show the amount of time spent watching television and the amount of time spent doing homework last week by each
of 21 high school students.
Draw the line of best fit for these data points. (It doesn't have to be the exact line of best fit. Just draw your best approximation.)

Answers: 1


Other questions on the subject: Mathematics
Mathematics, 21.06.2019 18:00, bravomichelle75
Aschool puts on a play. the play costs $1,200 in expenses. the students charge $4.00 for tickets. there will be one performance of the play in an auditorium that seats 500 people. what is the domain of the function that shows the profit as a function of the number of tickets sold?
Answers: 2
Mathematics, 21.06.2019 19:30, bakaoffire
Mr. brettler is hanging up a 5-foot tall rectangular welcome sign in the gym. he has drawn a sketch on a coordinate grid. he has the lower vertices of the sign at (9, –3) and (–6, –3). where would the upper vertices be on the grid?
Answers: 1
Mathematics, 21.06.2019 19:30, Victoriag2626
When 142 is added to a number the result is 64 more then 3 times the number. option 35 37 39 41
Answers: 2
Mathematics, 21.06.2019 21:30, hannahkharel2
Two friends are reading books. jimmy reads a book with 21,356 words. his friend bob reads a book with one-and-a-half times as many words. which expression represents the number of words bob reads?
Answers: 3
You know the right answer?
The data points on the scatter plot below show the amount of time spent watching television and the...
Questions in other subjects:


History, 26.02.2021 01:50
Mathematics, 26.02.2021 01:50


Biology, 26.02.2021 01:50
Mathematics, 26.02.2021 01:50
History, 26.02.2021 01:50


