
Mathematics, 17.11.2020 21:10 shainaanderson24
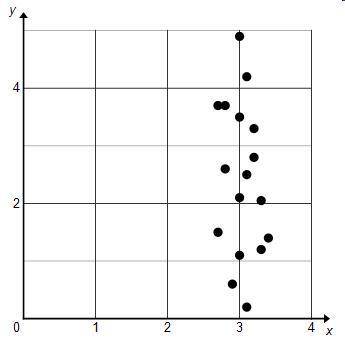
Which describes the correlation shown in the scatterplot?
A. There is a positive linear correlation.
B. There is a negative linear correlation.
C. There is no positive or negative correlation.
D. There is a nonlinear correlation.

Answers: 2


Other questions on the subject: Mathematics
Mathematics, 20.06.2019 18:04, genyjoannerubiera
30 points! i am confused. what does it mean by game time? you can use a table of random numbers or a random number generator to create random samples. also, you can obtain random samples directly using wolframalpha. com. for example, typing in randomsample[{1,2,3,4,5},2] will give you a sample of size 2 from the list {1,2,3,4,5}. a sample result is {1,5}. refreshing the page will generate a new random sample of size 2. 2. create five random samples of size two from the population. record the game times for the samples and calculate the mean game time of each sample. 3. create 5 random samples of size 11 from the population. record the game times for the samples and calculate the mean game time of each sample.
Answers: 2
Mathematics, 21.06.2019 23:30, Coolcatfurzy
Fill in the table with whole numbers to make 430 in five different ways
Answers: 1
Mathematics, 21.06.2019 23:40, yarrito20011307
20 ! jason orders a data set from least to greatest. complete the sentence by selecting the correct word from each drop-down menu. the middle value of the data set is a measure and is called the part a: center b: spread part b: mean a: mean absolute deviation b: median c: range
Answers: 1
Mathematics, 22.06.2019 00:00, Naomi7021
Which is a logical conclusion based on the given information? a. figure abcd is a rhombus by the definition of a rhombus. b. segment ac is congruent to segment dc by cpctc. c. angle acb is congruent to angle adc by the angle-side-angle theorem. d. triangle acd is congruent to triangle cab by the hypotenuse-leg theorem.
Answers: 1
You know the right answer?
Which describes the correlation shown in the scatterplot?
A. There is a positive linear correlation...
Questions in other subjects:


English, 19.09.2019 16:20

History, 19.09.2019 16:20

Geography, 19.09.2019 16:20


