
Mathematics, 17.11.2020 14:00 jaelynnm
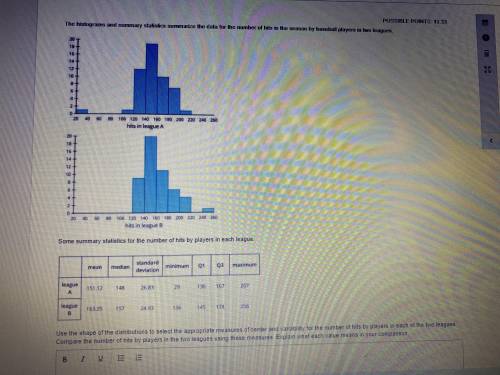
Use the shape of distributions to select the appropriate measures of center and variability for the number of hits by players in each of two leagues compare the number of hits by players in the two leads using these measures explain each value needs to your comparison

Answers: 2


Other questions on the subject: Mathematics
Mathematics, 21.06.2019 17:40, kayleeemerson77
The graph of h(x)= |x-10| +6 is shown. on which interval is this graph increasing
Answers: 2
Mathematics, 21.06.2019 21:00, ShahinF7536
Graph the equationy=x^2 -[tex]y = x^{2} - 2[/tex]
Answers: 1
Mathematics, 22.06.2019 00:00, colemanjosiah03
Find the percent cost of the total spent on each equipment $36, fees $158, transportation $59 a. 14%, 62%, 23% b. 15%, 60%, 35% c. 10%, 70%, 20% d. 11%, 62%, 27%
Answers: 3
You know the right answer?
Use the shape of distributions to select the appropriate measures of center and variability for the...
Questions in other subjects:


Mathematics, 06.05.2020 04:41
Mathematics, 06.05.2020 04:41


