
Mathematics, 28.01.2020 23:57 gunner20115
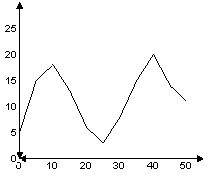
Suppose that a polynomial function is used to model the data shown in the graph below. for what intervals is the function decreasing?
a. 10 through 25 and 40 through 45
b. 10 through 25 and 40 through 50
c. 0 through 10 and 25 through 40
d. 10 through 50

Answers: 1


Other questions on the subject: Mathematics
Mathematics, 21.06.2019 16:30, jagdeep5533
Which function is odd check all that apply a. y=sin x b. y=csc x c. y=cot x d. y=sec x
Answers: 1
Mathematics, 21.06.2019 16:30, rhineharttori
Acircle has a circumference of 2 pi cm. which statement about the circumference and area is true? a comparison of the area and circumference is not possible since the area cannot be determined. the numerical values of the circumference and area of the circle are equal. the numerical value of the circumference is greater than the numerical value of the area. the numerical value of the circumference is less than the numerical value of the area.
Answers: 3
Mathematics, 21.06.2019 21:00, ImmortalEnigmaYT
Sue's average score for three bowling games was 162. in the second game, sue scored 10 less than in the first game. in the third game, she scored 13 less than in the second game. what was her score in the first game?
Answers: 2
You know the right answer?
Suppose that a polynomial function is used to model the data shown in the graph below. for what inte...
Questions in other subjects:


Arts, 30.11.2021 04:00
SAT, 30.11.2021 04:00
Mathematics, 30.11.2021 04:00

SAT, 30.11.2021 04:00


