
Mathematics, 17.11.2020 01:00 katherinemoreno353
Answer to this:
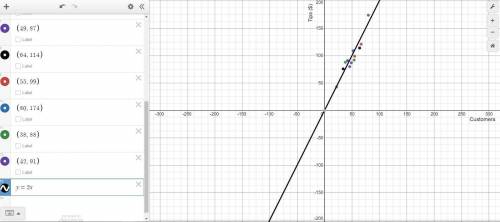
You and your business partner track the number of customers served and the amount of tips collected per day. The data you gathered is displayed in the chart below.
Servers’ Collected Tips
Customers 54 46 34 67 52 22 49 64 55 80 38 42
Tips ($) $92 $80 $76 $121 $109 $43 $87 $114 $99 $174 $88 $91
a) Create a scatter plot displaying the data in the table. Be sure to include a linear trend line.
b) Find the equation of the trend line (line of best fit). Show your work.
c) Predict the amount of tips that would be collected if 100 customers were served at the restaurant on a given day. Explain your reasoning.
d) Explain how to use the regression calculator to make a reasonable prediction given a data table.
ISSS:
Simply create a scatter plot then write in a line of best fit.
Step-by-step explanation:

Answers: 1


Other questions on the subject: Mathematics
Mathematics, 21.06.2019 20:00, cielo2761
The table below represents a linear function f(x) and the equation represents a function g(x): x f(x) −1 −5 0 −1 1 3 g(x) g(x) = 2x − 7 part a: write a sentence to compare the slope of the two functions and show the steps you used to determine the slope of f(x) and g(x). (6 points) part b: which function has a greater y-intercept? justify your answer. (4 points)
Answers: 2
Mathematics, 21.06.2019 23:30, tyresharichardson29
Ahighway between points a and b has been closed for repairs. an alternative route between there two locations is to travel between a and c and then from c to b what is the value of y and what is the total distance from a to c to b?
Answers: 1
You know the right answer?
Answer to this:
You and your business partner track the number of customers served and the amount o...
Questions in other subjects:


Mathematics, 12.08.2020 07:01


