Mathematics, 16.11.2020 20:20 yedida
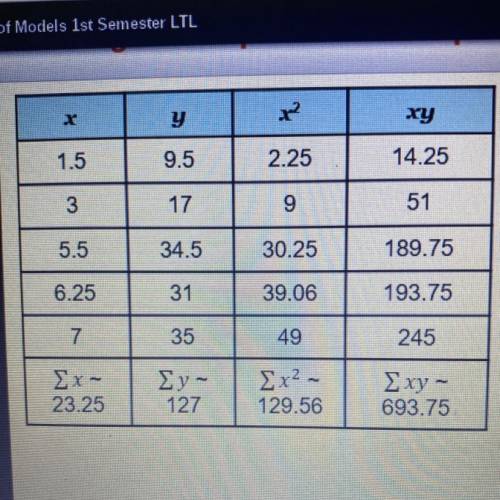
The table shows the relationship between the number
of trucks filled with mulch (x) and the number of tons of
mulch (y) delivered by a landscaping company. Which
regression equation models the data?
y = 4.8x + 3
y = 3x + 4.8
y = x + 20.8
y = 20.8x + 1


Answers: 3


Other questions on the subject: Mathematics

Mathematics, 21.06.2019 14:00, brookeguilford
If benito is selecting samples of five values from the table, which row will result in the greatest mean? row 1 row 2 row 3 row 4
Answers: 2


You know the right answer?
The table shows the relationship between the number
of trucks filled with mulch (x) and the number...
Questions in other subjects:

Mathematics, 05.02.2021 17:10

Social Studies, 05.02.2021 17:10


Biology, 05.02.2021 17:10

Mathematics, 05.02.2021 17:10

English, 05.02.2021 17:10

Mathematics, 05.02.2021 17:10


