
Mathematics, 16.11.2020 19:50 mercedesamatap21hx0
ANSWER NOW PLEASE IF YOU GIVE SOME RANDOM ANSWER YOU WILL BE REPORTED
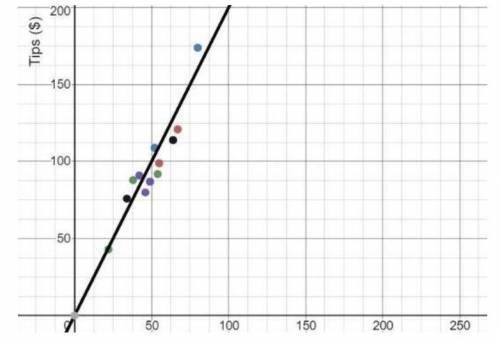
You and your business partner track the number of customers served and the amount of tips collected per day. The data you gathered is displayed in the chart below.
Servers’ Collected Tips
Customers 54 46 34 67 52 22 49 64 55 80 38 42
Tips ($) $92 $80 $76 $121 $109 $43 $87 $114 $99 $174 $88 $91
a) Create a scatter plot displaying the data in the table. Be sure to include a linear trend line. (2 points)
b) Find the equation of the trend line (line of best fit). Show your work. (2 points)
c) Predict the amount of tips that would be collected if 100 customers were served at the restaurant on a given day. Explain your reasoning. (2 points)
d) Explain how to use the regression calculator to make a reasonable prediction given a data table. (2 points)

Answers: 2


Other questions on the subject: Mathematics
Mathematics, 21.06.2019 22:30, cbkhm
Tommy buys a sweater that is on sale for 40% off the original price. the expression p -0.4p can be used to find the sale price of the sweater, where p is the original price of the sweater. if the original price of the sweater is 50, what is the sale price?
Answers: 1
You know the right answer?
ANSWER NOW PLEASE IF YOU GIVE SOME RANDOM ANSWER YOU WILL BE REPORTED
You and your business partner...
Questions in other subjects:

History, 31.10.2019 06:31

Advanced Placement (AP), 31.10.2019 06:31
Mathematics, 31.10.2019 06:31
Mathematics, 31.10.2019 06:31
Mathematics, 31.10.2019 06:31


